Now that we've established some measurement sticks, it's time to estimate the point from which we can use these tools. In other words, if we know what unit costs are relative to each other, how do we establish what the current market conditions should reflect onto current unit costs.
The best method to circumvent the rosy and misrepresentative data you will hear from realtors, is to use an index for comparable sales over a long period of time. The Case-Shiller index provides such data for major metropolitan cities throughout the country. Our closest proxy for Hoboken real estate would be the data for New York City.
As goes NYC, so goes Hoboken - with a growing premium or spread in NYC's favor over the past few years. That might surprise you but on a relative basis, stable or lower property taxes in NYC have been the impetus for more rapid price increases, depending on the part of NYC.
Case-Shiller has already accurately pointed to a decline in NYC real estate and further erosion of pricing in the foreseeable future. Those who have refused to remove their rose-colored glasses about the "Gold Coast" will quote ridiculous data which implies that Hoboken has "held up" or continues to "attract interest" - none of which gives any meaningful data about what's going on. If asking prices in Hoboken were about 5% above closing prices over this recent period, can you imagine what current reality dictates? Let me help with that.
Using the NYC data from Case-Shiller, one can extrapolate the point in time where current prices have returned to, in historical terms. For NYC, that period is March 2005! And consider that Manhattan (compared to other boroughs) has skewed this outcome considerably until this past year.
Given that the current pricing environment is "objectively" estimated to equal March 2005 levels and the irrational exuberance of 1025MP (the poster child) buyers in 2006, I give Toll Brothers plenty of marketing credit in determining a premium, rather than a discount, to their pre-construction quotes in 2005.
In other words, the units that were resold at similar or lower prices were actually reflective of what NYC was experiencing on a comparable basis for the "average home" and the "average buyer." While many will argue that 1025MP is above average in Hoboken RE terms, the point to draw from this is that the TIMEFRAME is the important inflection point for all properties, regardless of profile. Hence, our normalization of all data within the 1025 building itself.
Now, Toll can list those units at whatever price they wish until buyers are blue in the face. But that's what distinguishes the emotional buyer from the objective buyer. Toll has enough cash to sit the situation out at the cost of current MP owners. Those points and my about-face on TOL stock were explained in an earlier post.
We now have the data to benchmark and backtest the March 2005 valuations in Hoboken. As the poster child, I am choosing 1025MP as a best-case scenario compared to other properties in the city. That conservative approach suggests that this buyer's market will be offered for several more years - not months - as some would have you believe. More importantly, MP prices will likely fall harder than others given the initial marketing pump. In stock markets, the role of "pump 'n dump" is played by the floor specialist. See the analogy?
My next discussion will point to some examples of 1025MP units up for resale. That will serve another reality check as the disparities will only serve to depress future valuations here. I have mentioned the viscious circle before: that (re)sellers are taking their cues fromeach other, Toll and brokers, rather than the market. Slowly, they are realizing that they are looking in a mirror rather than out a window. Unfortunately, that only depletes their monthly cashflow and maintains the marketing machine for the builders and marketers. The psychology behind their purchase will not allow them to take a loss.
When owners discuss their properties in tax deduction terms instead of cash flow, they are sailing down a river called de-nial...
Wednesday, July 30, 2008
Monday, July 28, 2008
Unit Cost - A Dose of RE.ality
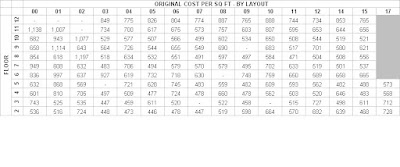
As I dig deeper into some 1025 MP numbers and the time frames within which the sales were executed, the picture brings some quantitative clarity to the due diligence process without emotional distraction. On the left axis (y) are the floors, stacked in rising order as they are visualized in the building. On the top axis (x) are the unit layouts at MP. This layout categorization normalizes any differences due to directional location of the unit. The only difference remaining is the elevation, rather than position.
The layout number(s) is/are the last digits of the units on each of the specified floors.
I should note that - in this particular grid - I attempted to calculate the ORIGINAL OFFERING cost per square foot associated with every unit in the 1025 building. However, a few of the data points were from resales and some were not available at all, for a number of reasons (including no sale yet). However, such "outliers" are easy to spot given the map configuration.
The importance of this exercise is to put valuations in context with the original offering prices. In some situations - contrary to popular opinion - units were resold A YEAR AGO at little or no profit, even a loss by the first owner(s)!
As I publish more of these results, I welcome any input on missing data or corrections. The results in the grid are "$/sq ft" for original sales in the new development - without weightings for property taxes and maintenance fees. Future grids will incorporate those categories as well, in order to remove all emotional stigma from the cost of carry in these "INVESTMENTS."
Two words...
Buyer beware!

Sunday, July 27, 2008
Hoonah, Alaska? No, It's Maxwell Place!
The following has been excerpted from a blog by J. Christoph Amberger.
It is very representative of how I view the Hoboken situation surrounding real estate and the promotion of developments like Maxwell Place under such an environment. As I said before, the outcome from such inexperienced behavior is always ugly... read on and try to associate this situation with what we are witnessing. The mirror image is telling. In the case of 1025 MP, all the hoarding has forced underwater (cashflow negative) investors to rent their units while they await a recovery to their sell asking price.
Can you see what I'm seeing? 1125 MP will be delayed yet again. A few smart people have walked away given the excuse from delays.
-----------------------------------------------------
"The need to park capital in productive assets
Just think back to the beginning of the U.S. real estate boom.
As a publisher of financial information services, I dislike reminiscing about 2001. Even though April 2000 had marked the end of the Internet stock market boom, the flight out of equity didn’t really gather full steam until 9/11. But the trillions of dollars in stock market capitalizations did not “vaporize”, as many financial gurus claimed and instructed their marketing folks to trumpet. Capital flows shifted… away from stocks and straight into the one asset that, common sense told you, “the good Lord wasn’t making any more of.”
Instead of automatic contributions to 401(k)s and IRA portfolios, they transmogrified into mortgages. Down payments. “Earnest money.” They went to service 30-year mortgages, sub-prime mortgages, ARMs.
I recall talking to one of our Taipan VIP Members then who patted me on the shoulder, assuring me he had moved out of stocks completely and put all his money into real estate.
And for the next five years, real estate was the place to be.
All of America became like Hoonah, Alaska.
Desolate fish packing plant turns into tourist mecca
Hoonah, population 860, is a small village on Chichagof Island in Alaska, United States. It is only accessible by boat or plane. Its claim to fame was a fish packing plant that employed most of the population. About 14.3% of families and 16.6% of the population lived below the poverty line.
There are also about 3,000 coastal brown bears roaming the island wilderness. Their presence is not conducive to the desire for all-round safety instilled in normal American suburbs. But it was sufficiently attractive for cruise line Royal Caribbean to chose Hoonah — or Icy Point Strait — as a day stop for some of its Inside Passage Cruises back in 2005.
Now, every couple of days, a cruise ship disgorges several thousand passengers onto the island. They go look for bears, paddle kayaks up and down the rocky shore, watch bald eagles fight over fish carcasses — and flood businesses with cash in exchange for smoked salmon, mini Ulu knives (Made in China) and miniature totem pole keychains.
The town is awash in money. And in less than two years, real estate went through the roof.
On the one major road leading into town, you walk past a shack. In Maryland, you’d be able to buy a prefab counterpart from an Amish barnmaker for three thousand bucks. In Hoonah, they’re asking $300,000. Bring your own paint. And nails. And tar paper.
Not that anyone is buying. People live the way they have always lived… most of them in cottages provided by the Federal Government after a fire wiped out half the village back in the late 1940s…
Cottages that on paper are now worth more than a prosperous Mid-Atlantic suburb.
Landrush 2000
Alas, while the dear Lord hung up his shingle of creating more real estate six-thousand or 60 billion years ago (depending what time table you subscribe to), real estate developers and home builders had no such qualms.
Between 2001 and 2007, every quarter acre of free land in the vicinity of a fixed settlement was plastered with boxes made of ticky tacky boasting cathedral ceilings and brass entry lights. First, there was genuine demand. And it was obvious: American real estate was clearly undervalued… the Echo Boom generation was pushing into elementary schools… and the U.S. are adding the equivalent of Chicago’s entire population each and every year.
Then the pay-off of owning real estate became apparent. Soccer moms turned into real estate agents and carpenters turned into professional property flippers. Home equity loans fueled spending.
But demand for timber, copper, consumer appliances pushed up commodity prices. Especially oil.
In America, people started burning corn for heat and destilling grains into hootch to fuel their ride to Whole Foods. To the sensitivities I inherited from my German WWII- and Cold War-imprinted parents, that’s worse than lining a litter box with pages torn from a first edition of Goethe’s Faust.
For agro-commodity speculators, it was a windfall…
Until the greater fool theory ran out of greater fools.
Reversal of fortune
Suddenly, there’s little money left in selling real estate. (Except maybe in Hoonah!) And since the banks who enabled people to leverage themselves are running low on cash as well, stocks have been taking another beating — the second in a decade.
And with equity and real estate out of the picture, the markets have begun to look like the line-up of Presidential candidates in May.
Oil right now is the Obama of commodities: The one remaining thing left bobbing in a sea of ennui and disenchantment. Lightweight yet full of perceived potential usages. An object of hope for the drowning, the desperate, the drifting. And those who prefer the rainbow sheen of surface refraction to deeper exploration.
Much like the bubble machines for real estate and Internet stocks before, rampant speculation masks as solid demand. Predictions of $170 or even $300 per barrel seem as reasonable as a $300,000 price tag for a Hoonah shack or $500 for a share of Pets.com in 1998."
J. Christoph Amberger
excerpted from blog titled "Insiders Preparing for Major Drop in Oil Prices" posted July 27, 2008
Wednesday, July 23, 2008
1025 MP - A Historical Spreadsheet
Let's start with some basics that will establish the foundation for putting forthcoming data into "objective" context.
Although the data below is sourced from publicly available databases and subscriptions, it's believed to be reliable but it's accuracy cannot be assured by the author.
1025 Maxwell Place:
Original buyers commenced closings on pre-construction commitments in November 2006 for the lower floors and continued through September 2007 for the top floors.
The building houses 169 residential units on 11 floors above a street level mandated for leased retail space(s), 12 floors total.
Toll Brothers "reserved" certain units from the original offering and their current status remains unknown. No units are considered "sold" until a formal/legal closing.
At least 25 (15%) of the units are known to be offered for sale or rent by existing owners. A few are offered for either type of occupancy.
Any unit's value per square foot is dependent upon two primary factors - directional placement within the floor and floor level. Since the varying layouts are aligned vertically, the following data has been compiled by layout rather than size and floor. For example, unit 305 is similar in layout and directional placement to unit 405 - only the floor level differs. These examples will be referred to as the "05" layout.
There are 16 possible layouts numbered "00" through "17" with the omission of numbers 13 and 16. All floors may not be exactly the same in layout composition but square footage and average cost of the layout will still be factored in for normalization purposes, in conjunction with the floor level. Original buyers' upgrades may have varied.
00:
966 sq ft (floors 2 through 12)
01:
2,185 sq ft (floors 2 through 5) and 2,006 sq ft (floors 6 through 12)
2,185 sq ft (floors 2 through 5) and 2,006 sq ft (floors 6 through 12)
02:
1,588 sq ft (floors 2 through 5) and 1,430 sq ft (floors 6 through 12)
1,588 sq ft (floors 2 through 5) and 1,430 sq ft (floors 6 through 12)
03:
1,231 sq ft (floors 2 through 5) and 1,703 sq ft (floors 6 through 12)
1,231 sq ft (floors 2 through 5) and 1,703 sq ft (floors 6 through 12)
04:
1,950 sq ft (floors 2 through 5) and 1,495 sq ft (floors 6 through 12)
1,950 sq ft (floors 2 through 5) and 1,495 sq ft (floors 6 through 12)
05:
1,198 sq ft (floors 2 through 5) and 1,518 sq ft (floors 6 through 12)
1,198 sq ft (floors 2 through 5) and 1,518 sq ft (floors 6 through 12)
06:
1,865 sq ft (floors 2 through 5) and 1,298 sq ft (floors 6 through 12)
1,865 sq ft (floors 2 through 5) and 1,298 sq ft (floors 6 through 12)
07:
1,133 sq ft (floors 2 through 5) and 1,062 sq ft (floors 6 through 12)
1,133 sq ft (floors 2 through 5) and 1,062 sq ft (floors 6 through 12)
08:
1,281 sq ft (floors 2 through 5) and 1,314 sq ft (floors 6 through 12)
1,281 sq ft (floors 2 through 5) and 1,314 sq ft (floors 6 through 12)
09:
1,177 sq ft (floor 2) and 1,139 sq ft (floors 3 through 5) and 894 sq ft (floors 6 through 12)
1,177 sq ft (floor 2) and 1,139 sq ft (floors 3 through 5) and 894 sq ft (floors 6 through 12)
10:
1,281 sq ft (floors 2 through 5) and 1,317 sq ft (floors 6 through 12)
1,281 sq ft (floors 2 through 5) and 1,317 sq ft (floors 6 through 12)
11:
1,062 sq ft (floors 2 through 5) and 1,342 sq ft (floors 6 through 12)
1,062 sq ft (floors 2 through 5) and 1,342 sq ft (floors 6 through 12)
12:
1,920 sq ft (floors 2 through 5) and 1,340 sq ft (floors 6 through 12)
1,920 sq ft (floors 2 through 5) and 1,340 sq ft (floors 6 through 12)
14:
1,361 sq ft (floors 2 through 12)
1,361 sq ft (floors 2 through 12)
15:
1,331 sq ft (floors 2 through 5) and 701 sq ft (floors 6 through 12)
1,331 sq ft (floors 2 through 5) and 701 sq ft (floors 6 through 12)
17:
701 sq ft (floors 2 through 5)
701 sq ft (floors 2 through 5)
 Left: A floor plan indicating directional placement of the above-mentioned layouts.
On a side note, the average 30-year fixed mortgage has just reached 6.50%, the highest level for such home financing since April 2002 according to Bankrate.com. Recall that one of my premises for trouble in Hoboken is independent of location. It is the removal of the free credit era, and more seriously, the adjustments necessary in raising credit quality.

The 1025 "spreadsheet" is raising some very interesting questions which support my earlier skepticism about Toll and reseller expectations. Hint: They weren't even close to begin with and the gap is growing wider as other cost factors worsen the valuation outcome of the analysis.
Stay tuned... RE.porter - A Little Dose of Reality
Sunday, July 20, 2008
Poster child - Toll Brothers' Maxwell Place
While the ultimate prize title should go to the W Hoboken Residences, there are only about forty units in that development adjoined with the hotel services chain. It will be a topic of future posts, I'm sure.
Many of the property value-related questions I get are related to the Maxwell Place (new construction) and Hudson Tea (gutting renovation) buildings at the north end of town. While Toll is building MP from scratch, they simply bought and took over the HT site, among several other land and building development deals (incl. 700 Grove, Harborside Lofts, Hudson Tea expansion, etc.).
MP interests me because it is a shining example of marketing gone rampant; during what was probably... the... very... top... of the market. It used to be that a river/city view added a 15% (or so) premium to your Hoboken property. Somehow, Toll has magically enhanced that valuation premium to a 100% or so - or the unit base cost is wrong! Hmm... and all this at prices above those closed at pre-construction prices - near the market top - with their 1025 Maxwell building. Four buildings are slated for erection. 1125 Maxwell is currently under construction and has undergone some schedule delays so far.
Now there's a great methodology for defining unique! Stack high-density structures next to one another and market them all as part of a "luxury waterfront" development. No doubt, the tax roll is welcomed; but at what cost in the city's original negotiation? The city's building inspector just happened to call the 1025 development home at the time as well, so the state decided to take over that slight conflict of interest. What's Governor Corzine's line here? Inquiring minds want to know!
I've got nothing against the trendy and upcoming north end of the city, but there's a reason it was developed last. Remember those three principles? Well, ferries and a shuttle van don't exactly comfort my rushed style to commute in the morning - unless I was working in the western part of Midtown! None of my querying friends could admit to that need. The view of course, is spectacular; if you get enough time from your commute connections to enjoy it. Okay, that takes care of the location thing. Let me explain.
Although I'll discuss the current pricing basis later, cost of ownership needs to assess maintenance fees and property taxes as well; the first being of Toll design and the second coming from our starved coffers at city hall. Well, we all know what homebuilders are challenged with in the financing world so the current 1125 delays should come as no surprise. Many have argued that the changeover to state oversight is to blame. I doubt it. I would just as easily argue that it was rushed through without proper due diligence during the city's oversight of the matter and the current rate is the norm. Call me cynical, but somehow the Toll and Hoboken council relationship would have probably grown some deep roots given the company's sudden stature in town.
Since some 1025 data is available, one can see that maintenance fees are already steep - without most of the amenities that 1125 will bring to the promised facilities. Current 1025 fees run around $0.58 per month per square foot of unit space. That will include maintaining parking amenities assuming one parking space per unit. So a 1,500 square foot condo at 1025 is paying about $870 per month for maintenance alone. And what are the odds that those fees will go up again, given the construction business woes? Somebody's going to pay for it and I doubt that Toll is going to get charitable with their current revenue trends.
Note: Toll Brothers lost money in their current quarterly reports. And those results are more likely part of a new trend rather than a quarterly aberration.
Disclosure: I have recently bought shares of TOL for accounts I manage or advise. Those accounts were short homebuilder stocks until last week. Don't confuse my positive sentiment of TOL stock with my forecast on Toll property values. There is no relationship there and it would take a longer story!
That leaves the 1025 folks carrying the load since any potential 1125 buyers are still subject to any of their closings. Two things are going wrong on the 1125 front. First of all, recent credit standards will likely eliminate a fair portion of originally interested buyers. Don't feel sorry for them. They probably shouldn't have been buyers in the first place if that's the case. Secondly, the combination of increased layoffs in this demographic and increasing unit inventory (yes, even in Hoboken) may result in either more 1125 delays or insufficient buyers.
All along, Toll has given the impression of holding their pricing while all around them crumble. If I'm an analyst, I like their stock - but I would hate to own at their developments, given the crunch scenario. Such a strategy will only continue to funnel greater costs through to the current and future owners. Unfortunately, that's the part of free market theory that always works well. Toll management is smart since the "Plan B" option is always available to them later, rather than sooner. What does that tell you about my thoughts on the buyers so far? No comment. But "pre-construction" is not a desired option in a buyer's market, not even in the great city of Hoboken, given it's proximity to NYC. In fact, chances are that the second half of this industry tsunami is going to hit Hoboken HARDER than most due to the quiet impacts being lashed out in NYC's financial services sector. Hobokenites make up a great portion of those once upwardly mobile professionals.
The property tax front doesn't help the above scenario. State coffers are already putting greater stress onto local budgets, but the City of Hoboken is going big (broke), or not at all. Hoboken's own budgetary crisis is going to lead to sizable tax increases from property owners; especially new ones like MP. Inflation is going to look very tame in comparison. That same 1,500 sq ft unit is already paying about $13,000 per year, with increases of about 10% to come soon - that's my own forecast.
While all these DEflationary forces are at work, unit values have to act. Get the picture? But by how much are current sellers dreaming? The listings I have observed so far don't even justify comment; and the market interest supports my cynicism. I will provide some of this data after doing some homework but first glance tells me that sellers are taking cues from each other, rather than the market. I suspect that the brokers and the developer have influenced this course with their own reselling and pricing policy.
Such a marketing strategy would buy time under historical lulls but this is not a repeat of history. Simply put: when free credit buyers are removed from the equation, the first leg of the pricing stool has been pulled out from under it. Flippers flocked to this development opportunity during its offering period and current resale listings indicate a substantial number of eager owners willing to rent (conserve cash flow) or sell at a profit. Human nature in capital markets trading reflects an equally hesitant desire to take a loss in real estate. The inevitable is never a happy outcome. We have a saying... "bulls make money, bears make money - pigs get slaughtered!" This is where emotional attachment clouds the mind and a home is viewed as something more than just an investment. Well it is; yet the due diligence required is compromised by exactly such decision paths.
The average homeowner lives in their property for about four years; even less in Hoboken given the younger demographics. The new Hoboken buyer (last two years) has an average financing ratio of 86%; this includes a sizeable count of established families here with more conservative financing ratios in that number. So leverage is a bit thin for the newbies on the block, with little room for loss (easily above 90%). More families are seen here and the schools have no capacity to service them, but the majority of those families are nowhere to be seen once the kids reach kindergarten or grade school age. That's an unfortunate review of our application of taxes in the school system here.
Sub-prime was definitely alive and well in Hoboken. Hence, my strong feelings about the oncoming undertow here, not unlike many parts of the country these past two years.
As mentioned earlier, I will have many posts dedicated to our poster child Maxwell Place.
Saturday, July 19, 2008
Why this topic and why now?
I have many friends who are realtors and many more who are homeowners. Their agendas toward property ownership are largely settled. But it's those acquaintances who are now debating the difficult choices of moving into the ownership column that really need some biased direction on the matter. Many new facts have surfaced, but are seldom discussed in the decision process due to an emotional attachment to the American dream.
I know that this lobby has been propelled by the highest of promoters in Washington, but where is the explanation of their guilt in the current morass?
Where Hoboken is concerned, there is a great deal of interest due to it's location - one of three historical rules or principles in addressing real estate. The other two of course, are location and location. While this city has avoided the extent of damage that other parts of the nation have undergone, it is my opinion that it cannot be avoided. And that if it is slower in impact, it will simply take longer.
The effect on one's equity remains the same - eroded or wiped out - and the consequences could be worse, depending on other localized influences. Do city debt, property taxes and required infrastructure come to mind?
While history can always serve guidance, adjustments in the market's structure can overwhelm any relative rule such as location. Location will simply aid in accomplishing a "not as severe" scenario - something I find useless in determining where capital should be invested in the first place. Ironically, it is a dislocation or mispricing that has to be recognized as the adjustment currently underway. Until that is realized, it will simply take longer for equilibrium to set in.
Timing is everything. And it is my opinion that the timing of the majority of Hoboken property development has coincided with the cusp of this mispricing - the era of free credit.
That is over. It's gone. And it ain't coming back for a long time.
This is when I find myself in the middle of a realtor's or homeowner's persuasion upon a prospective buyer. What is lost in the discussion is the free credit era "cost" that is being passed off as "value" to the last people standing in this game of musical chairs.
The lack of real estate market transparency is a natural tool for such aiding and abetting. The majority of data is "administered" by the National Association of Realtors (NAR) and it is fraught with transposition and misrepresentation. That line of marketing is carried down to every card carrying Realtor, your local expert. Those topics are discussed elsewhere but will be brought into related issues here.
I hope to pull local industry quotes and opinions here and refute the fiction that is sold as fact. With such a small physical area, Hoboken has an overwhelming influence by a few developers of local and national stature. While I will try to detach my local political opinion from these discussions, they have been an unfortunate driver overlapping this era of mispricing. Despite past prosecutions, the historical methodology for politics in this city seems to be alive and well.
As all these factors unwind - and I obviously believe they will - we will be pulled into the undertow that has simply worked more efficiently in other parts of this nation. My conclusions are based on "price" and admittedly pricing foundations vary throughout the square mile. This is where I rely on the forces of markets to act, regardless of near or long term.
Like most investments, it's value for the dollar. In RE terms, that's generally cost per square foot.
Subscribe to:
Posts (Atom)