The following is a national perspective with the foundation that Hoboken's factors are going to underperform for the foreseeable future.
----------------------------------------------------------
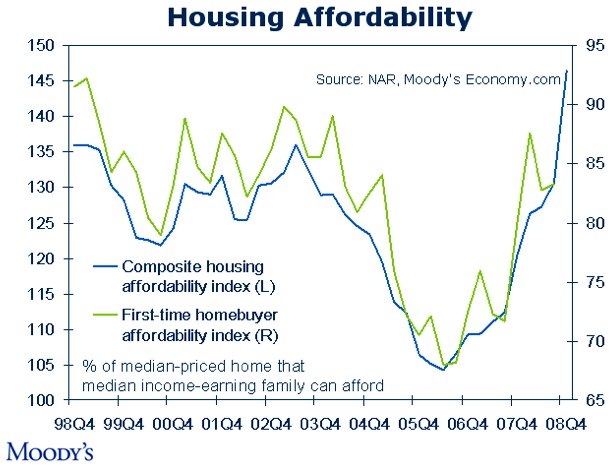
The good news is that recent price trends are strong in residential real estate. We have a quarter of price growth in the bag. Prices have also fallen so far since the summer-of-2006 peak that affordability is roughly equal to what it was at the turn of the century (2000). Nobody can argue that a fall of 30% doesn’t make it easier to buy. Is it the best time to buy?
click to enlarge
The bad news is that the financial media is incapable of balancing competing and complicating factors which any buyer of real estate must review.
If you look at mortgage payments and the number of past due accounts; if you look at the number of properties which are approaching or are now in negative equity (in which mortgage debt exceeds the value of the house); if you look at the supply of existing (not new) properties for sale; if you look at the systemic debt levels of consumers and of American society as a whole; if you look at unemployment; and if you look at the trends which history dictates after a credit crisis; if you look at all of these major factors, they are all negative for real estate.
Balancing these factors requires the intelligence to incorporate many different variables; a balance which is impossible on a breaking news story. All of these variables create a fuller opinion on the future of property values. You need this information to make a good decision about your most important investment – the purchase of your home. Look at the charts. Glance at the captions. What feeling does it leave you with? That feeling should be your “buy” or “sell” indicator.
The daily media is simply a dumb conformist blind man--chasing the latest number with no regard to competing claims, no memory, and no common sense.
You can’t be fooled again on the value of real estate.
(Page Down or Click here to see "Property Values: Ten Key Charts & Critical Commentary" -- a 360-degree view of property values.)
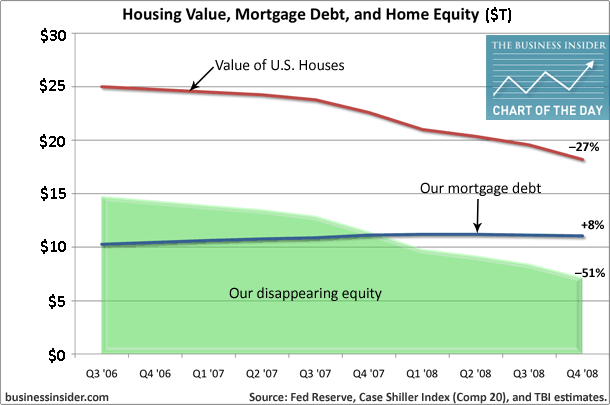
EQUITY VANISHES: About $7 trillion has been taken from the wealth account of property owners. If there are 130 million housing units in the United States (rental and owner occupied), then owners have lost an average of $54,000 per unit they own. The loss is massive.
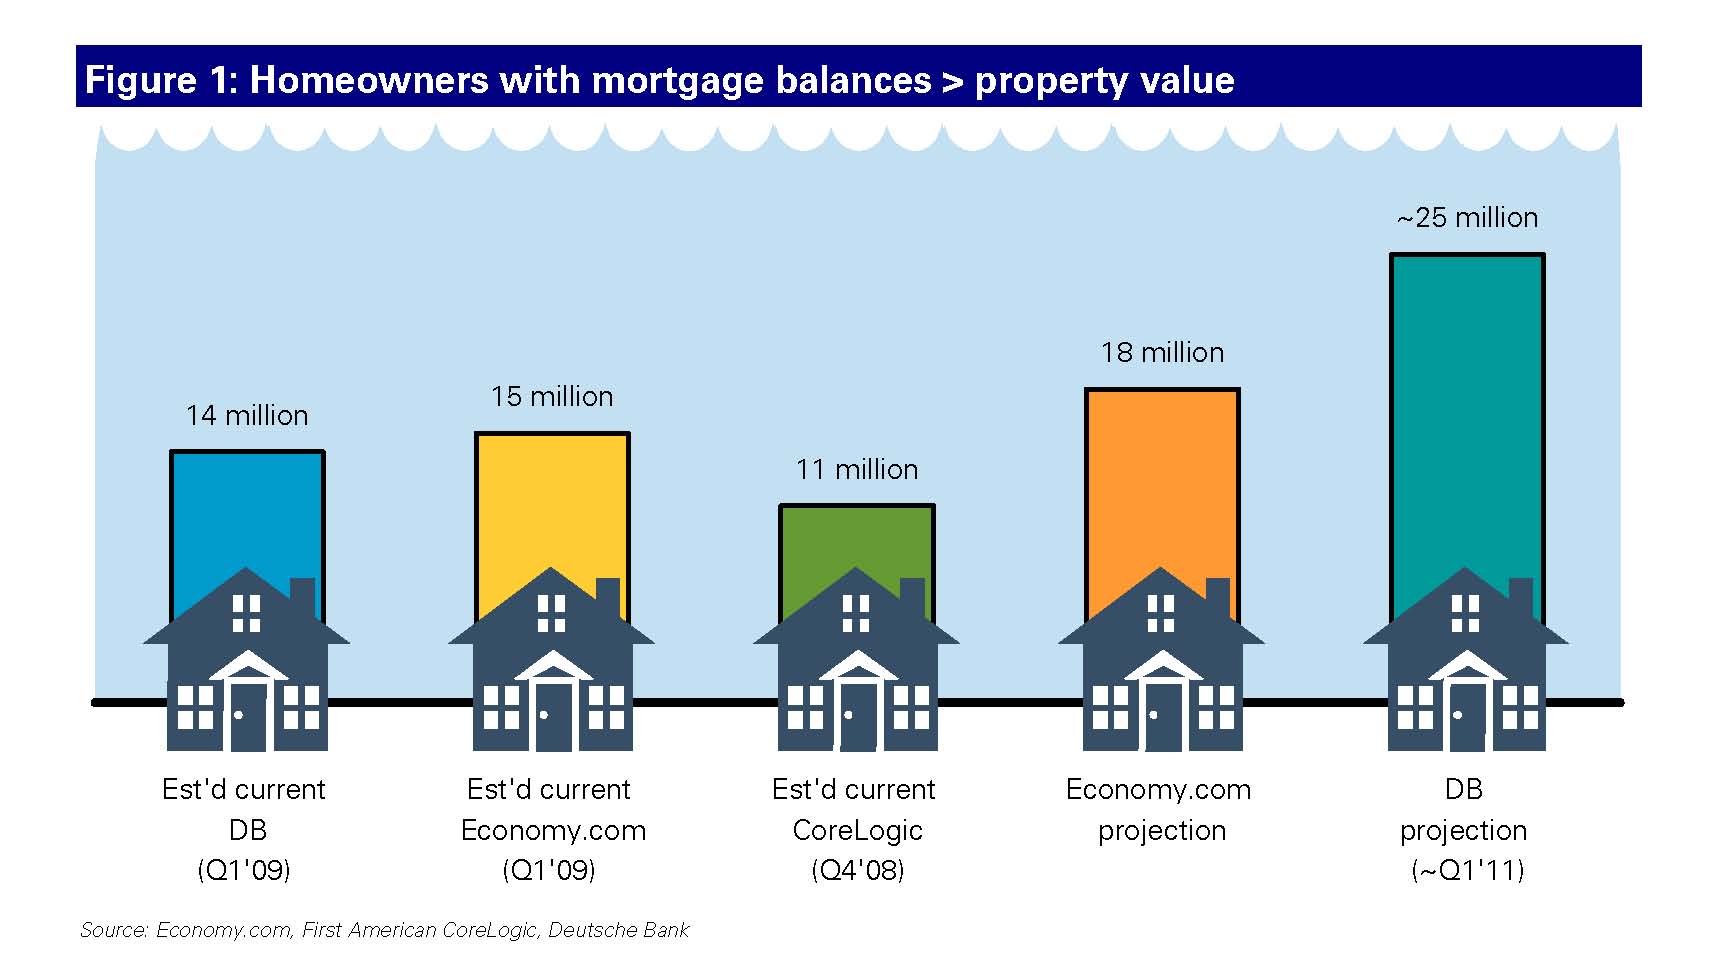
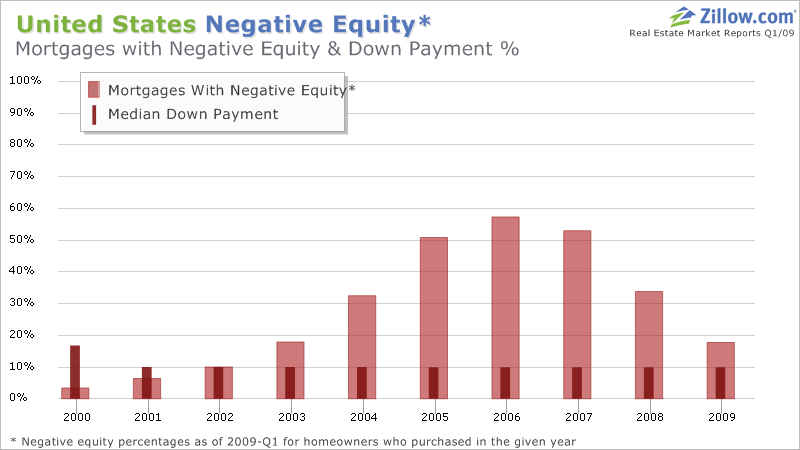
 NEGATIVE EQUITY – The TEN-TON GORILLA (8/13/09): How many homeowners would make money by walking away from their mortgage? Whether the number is 11 million or 25 million, the low and the high estimates in this graph, the risk factor is wildly high. It's exactly like Cheech & Chong on Spring Break in Cancun. They are forced into rehab after this last hurrah. And they know it.
GREEN SHOOTS: (10/1/09) There is good news in property values, although I have been warned about the accuracy of these numbers. My take: They can't be completely inaccurate. For the would-be buyer who likes what he sees in this picture, ask yourself first: Do I want a good deal on my home purchase or do I want a great deal? If you can get a good deal now, it's not going away soon. There may be a great deal in the future -- say the next year or two or three. It will be gone if you buy the good deal today.

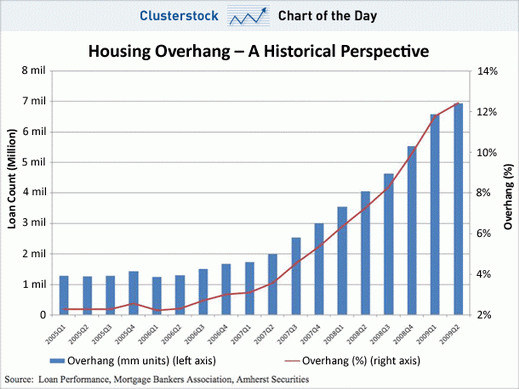
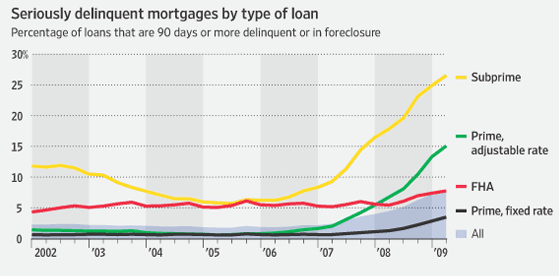
PAYMENT STRIKE (8/22/09): Foreclosure sales are a leading source of falling values. Payment performance on mortgages is terrible and getting worse. More than 4% of mortgages are in foreclosure. More than 13% of mortgages (ONE IN EIGHT) are behind. There is no indication of a turn-around in current payments on mortgages. How does optimism make sense of this payment history?

Green Vomit (9/25): How could anybody say this is a reasonable time to invest in real estate? You could either prove these numbers wrong, or you could check into the mental ward. Have you had your medication today?

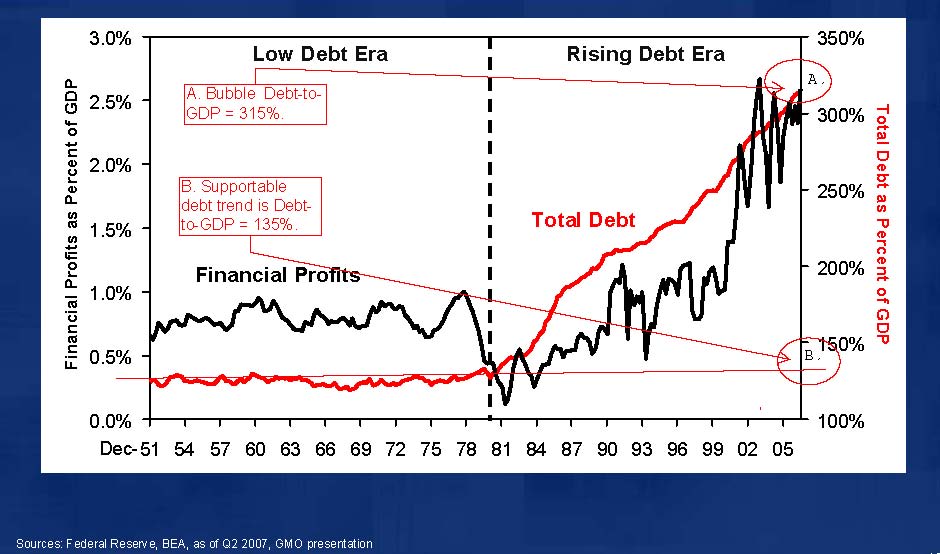
DEBT BE NOT PROUD (8/11/09): One school of thought says excess debt must be paid off or written off before we will achieve dynamic growth. This "Low Debt" and "High Debt" chart of approximately the last 60 years shows that the magnitude of debt, whether it be corporate or household, could be far beyond reasonable. If this school is correct, then we may have many years or even a decade of slow growth. The only cure would be radical steps to reduce debt. If we are in the hang over of a world-record credit bubble, then the outlook for real estate investment is negative.
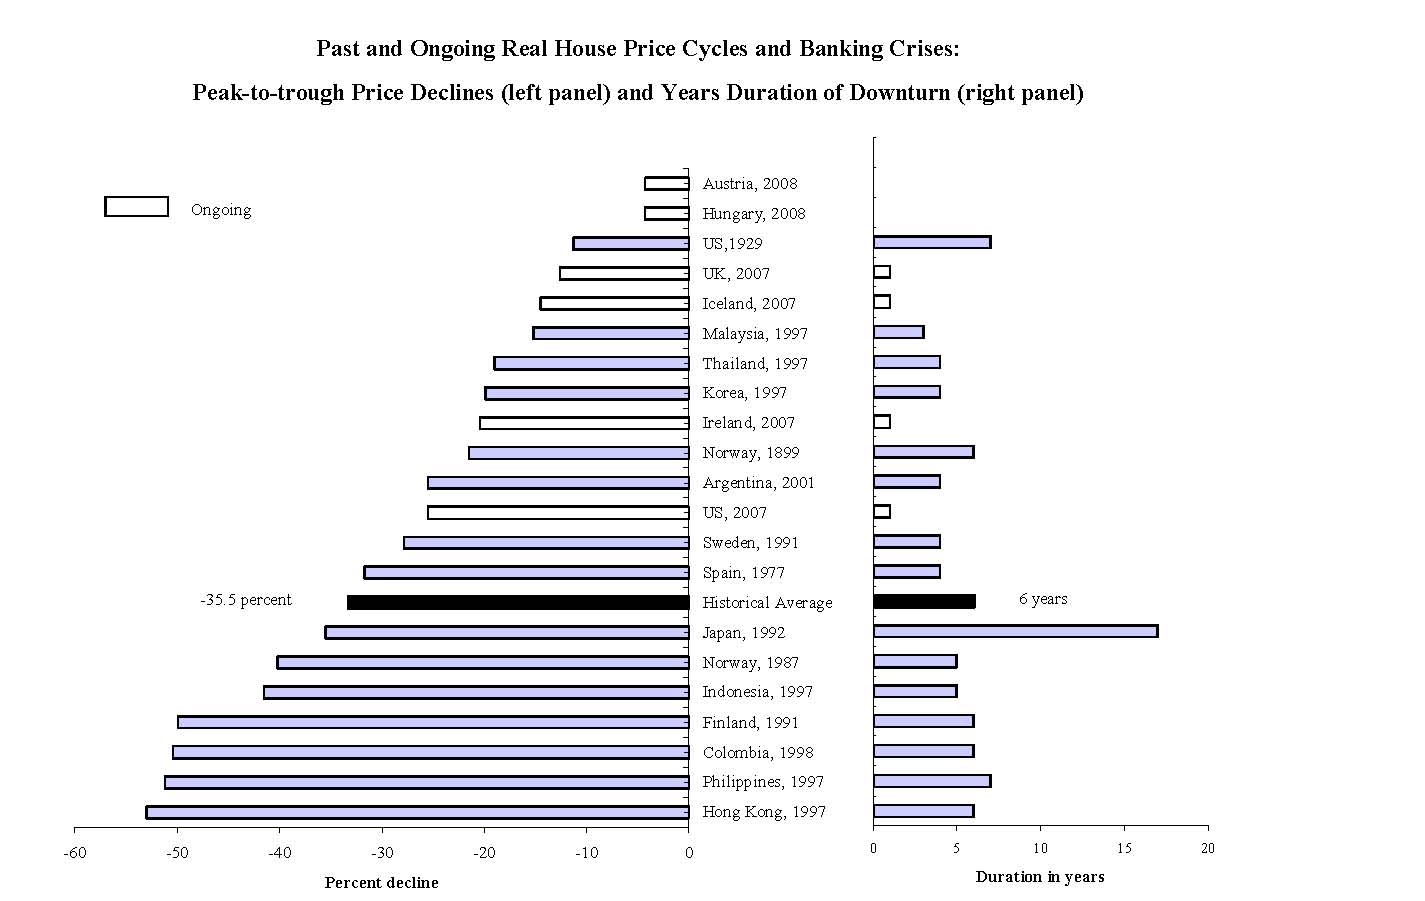
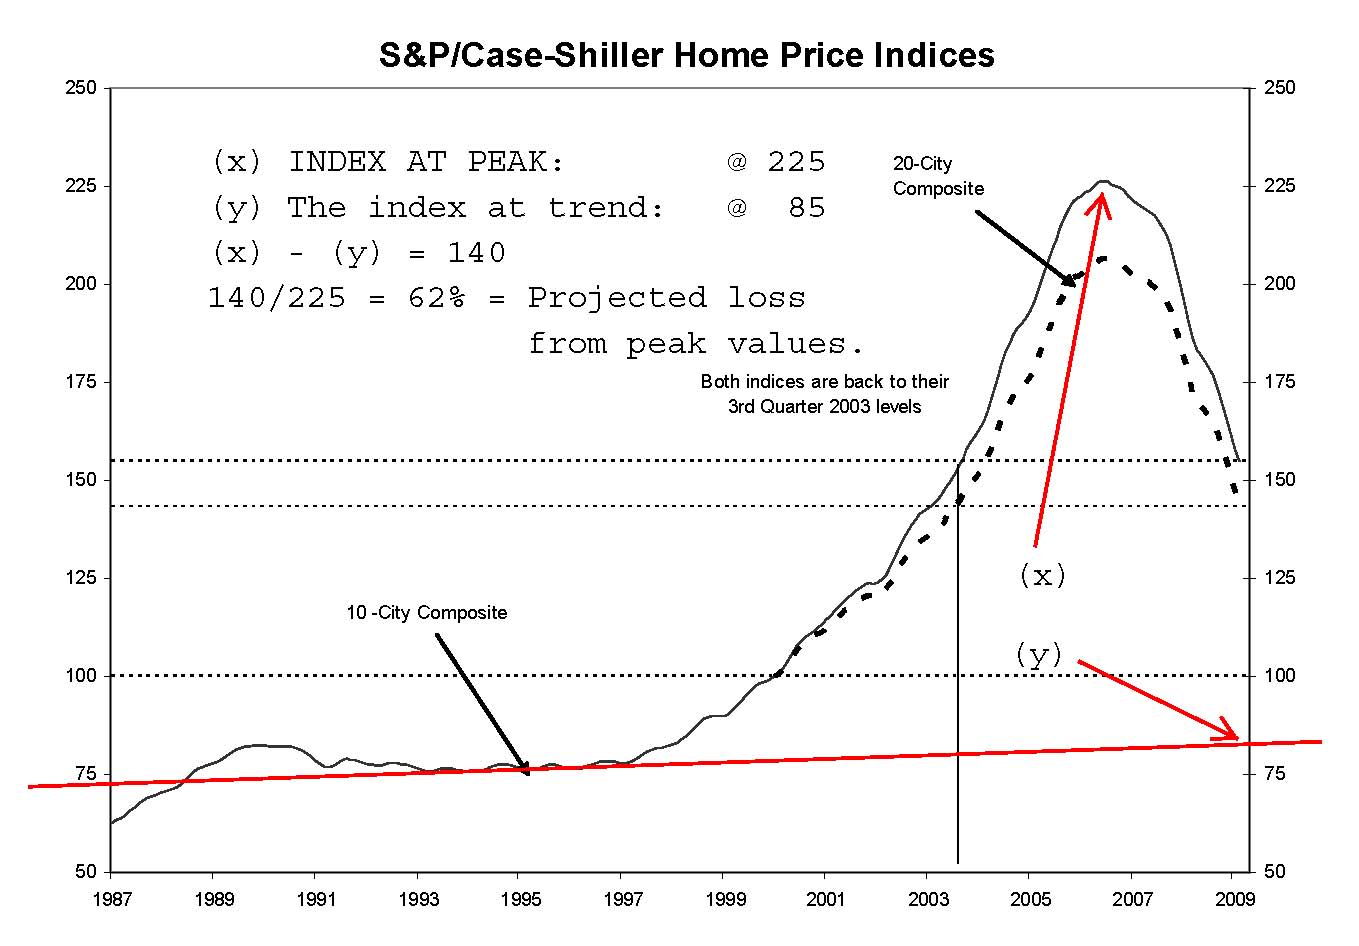
HISTORY'S TRENDS (8/5/09): The best research into credit bubbles says that property's value will fall through the summer of 2012 -- until three years from now. The good news is that the fall in values has nearly equalled the average fall of 35%. The bad news? What if we have a King-Kong credit bubble and it's actually not stupid to say "It's different this time."?

NEGATIVE EQUITY (8/6/09): The graph shows half of all mortgages issued in 2006 have a balance greater than the value of the house securing the loan. What will happen to loan performance if 50% of all mortgages are worth more than their collateral? Nobody knows, and if nobody knows, then a wild massive risk factor cannot be forecast. If you think that is impossible, please note that Deutsche Bank issued a report in early August saying that 48% of all mortgages would be worth more than their collateral by 2011. This is unchartered territory adjacent to the galaxy beyond the next universe.

SALES - PRICE (10/15/09): THE FALL IN PRICES: There is a lot of good news in the stock market today, but sentiment would turn 180 degrees if it was known that property values would fall 60% from their peak. Prices have already fallen @ 30%. If values fall according to the estimates in this graph, it is a certainty that banks and financial companies will fail en masse (again). There has been some good news about real estate prices lately, but the vast majority of indicators are still negative.

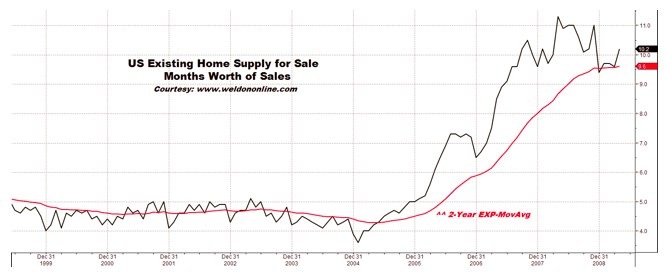
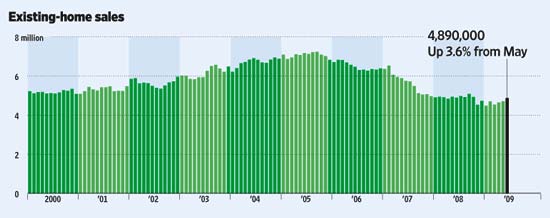
SALES -UNITS (8/5/09): Looking at the long trend, there has never been a serious problem in terms of the number of units sold. The quality of the sales is another question. The Wall Street Journal recently reported that two-thirds of sales are a form of distressed sale (Improving Home Sales Belie Market Reality, 8/21/09). "'Think about that for a minute,' John Mauldin of Millennium Wave Advisors wrote this week. 'Two-thirds of home sales are either foreclosures or banks taking a loss on the mortgage.' And only a third of the remaining one-third -- roughly 10% of overall sales -- comes from 'something we could call a normal selling process.'"
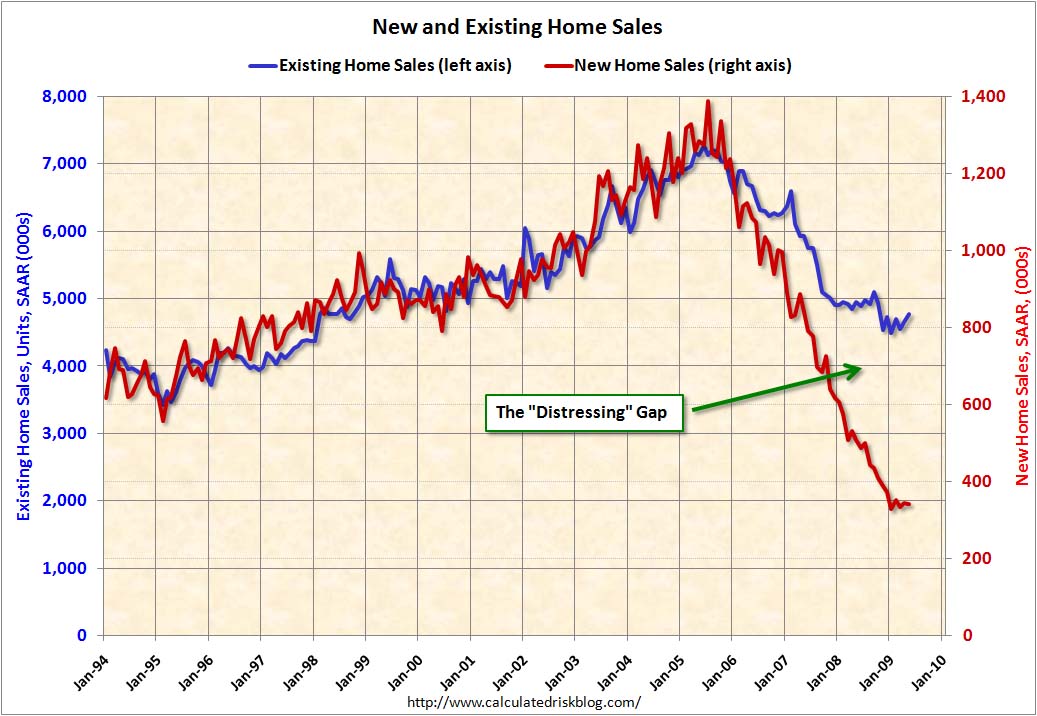
SALES - UNITS (8/5/09): NEW V USED: A wide gap has opened up between sales of new homes and existing homes. The trend began in 2006 and remains elevated. One explanation is that existing homes sold under distress offer a better bargain then new homes -- even if the new homes are marked way down. Something is buggy, and needs to be un-bugged.
No comments:
Post a Comment